Overview
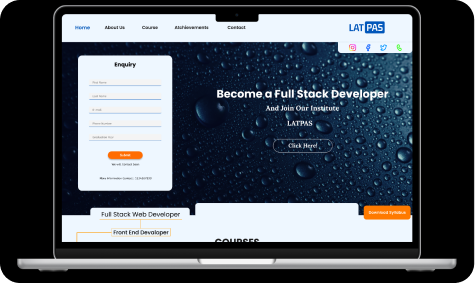
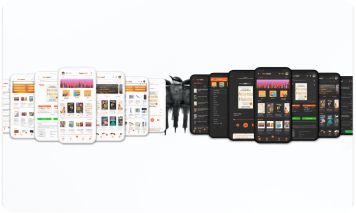
A dashboard UI system for teams that need to monitor metrics, tables, and reports. It solves the problem of messy data views by organizing information into clear reusable components.
The Challenge
Dashboard UI required balancing business goals, user expectations, and technical performance in the UX Design domain. The key challenge was creating a reliable, scalable experience that communicates value quickly while remaining easy to maintain and expand.
My Approach
The approach centered on UX process — user flow planning, wireframes, component system definition, and high-fidelity screens with interactive prototypes. This ensured design consistency and clear handoff for future development.
Key Features
- ✓
User flow and interaction mapping
- ✓
Reusable component and style system
- ✓
High-fidelity screens and prototypes
- ✓
Usability-focused information hierarchy
- ✓
Design handoff-ready structure
Results
Dashboard UI was successfully delivered with a clear, modern user experience and dependable technical execution. The solution is maintainable, scalable, and aligned with business goals for ongoing growth.